We use animation to show more dimensions of data. For example, in the Circular Treemap, using D3 Transition we are able to show the fourth dimension of data - time.
Using Linking & Brushing technique, implemented with jQuery. We aim to provide a set of intuitive and interactive visualization to help users create more insight of data.
Last but not least, Python has been used for data scraping and cleaning. It provides us with a great way to gain more data, and process data more efficiently.
Oftentimes, industries as a whole may significantly outperform or underperform the index as a whole.
An analytical tool based on fundamentals for facilitating investment decisions. Specifically, we aim to show, in a single view, the fundamental strength of a company plus its recent stock price performance.
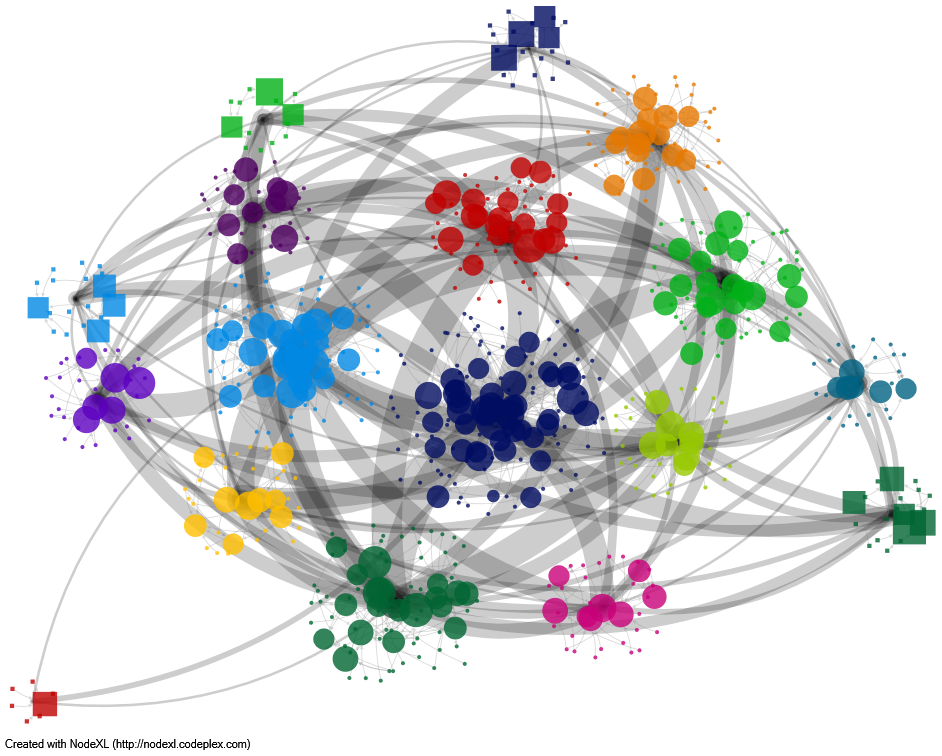
Unearth the relationship between stocks in another aspect - the interpersonal relationship between directors

COMP7507
Visualization and visual analytics
feifang@connect.hku.hk
Your comments are welcome.